

Alcohol-related Liver Disease (ALD) Models and Efficacy Services
Alcohol-associated liver disease (ALD) is one of the leading causes of preventable liver-related morbidity and mortality worldwide. The spectrum of ALD ranges from simple steatosis (fatty liver) to more severe conditions such as alcoholic steatohepatitis (ASH), progressive fibrosis, cirrhosis, and hepatocellular carcinoma (HCC). In severe cases, ALD can present as acute alcoholic hepatitis (AH), which may lead to acute-on-chronic liver failure (ACLF).
To better model disease progression and aid in the evaluation of potential therapeutic targets, GemPharmatech has developed an experimental mouse model of ALD that mimics the histopathological features of the disease.
Chronic-plus-binge ethanol feeding program induces alcoholic hepatitis (AH) based on the protocol shown below.

1. Chronic-plus-binge ethanol feeding induces liver damage in B6 and 750 mice.
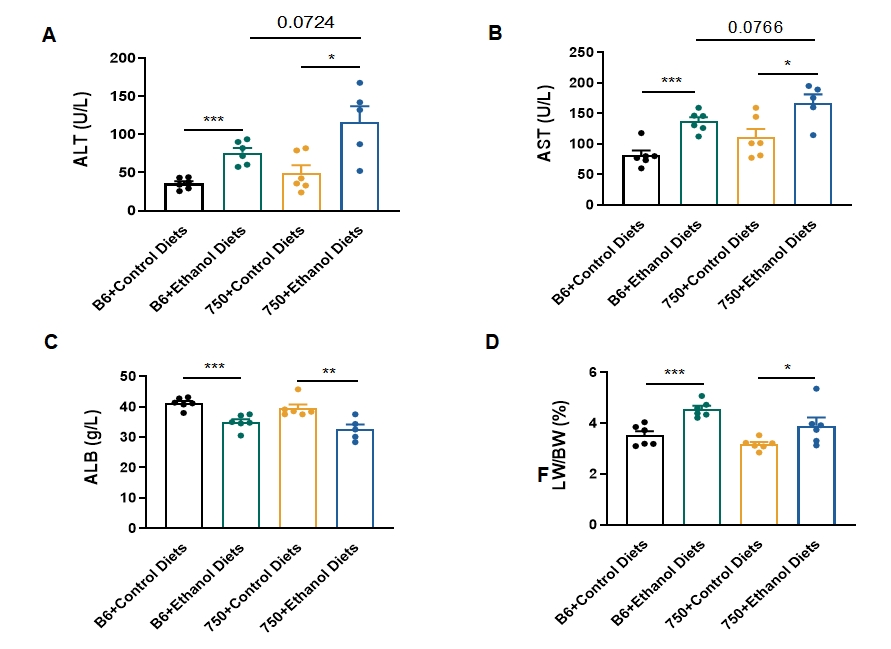
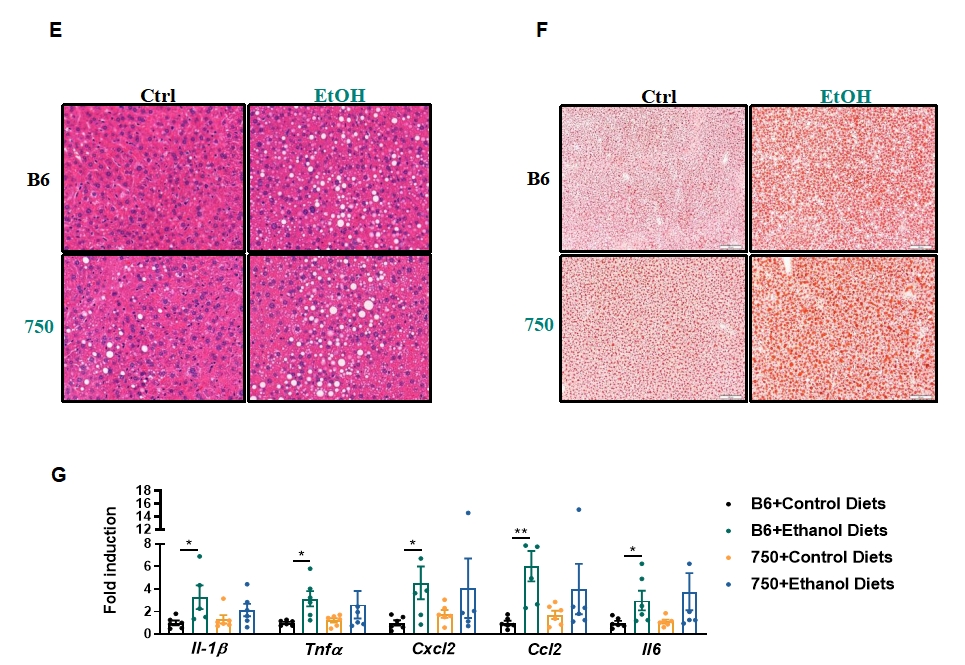
Figure 1. Chronic-plus-binge ethanol feeding induces AH
A-F, Eight-week-old female C57BL/6J mice and 750 mice were fed a liquid diet containing ethanol for 8 weeks-plus-one binge, the mice were euthanized at 9 hours post-binge. (A) Plasma ALT level. (B) Plasma AST level. (C) Plasma ALB level. (D) The ratio of liver weight and body weight. (E) H&E staining of livers. Scale bar = 20 µm. (F) Oil Red O staining of livers. Scale bar = 100 µm. (G) Real-time quantitative PCR analyses of pro-inflammatory genes. Data presented as mean ± SEM, *P<0.05, **P<0.01, ***P<0.001, unpaired t test. (n=6 mice per group).
2. Chronic-plus-binge ethanol feeding induces fibrosis and promotes inflammatory cell infilration in B6 mice.
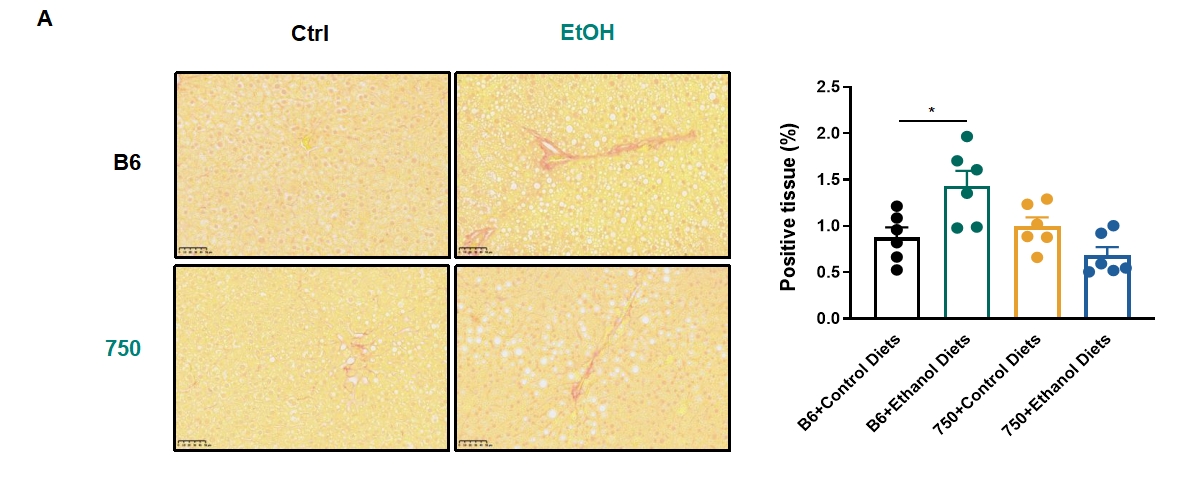
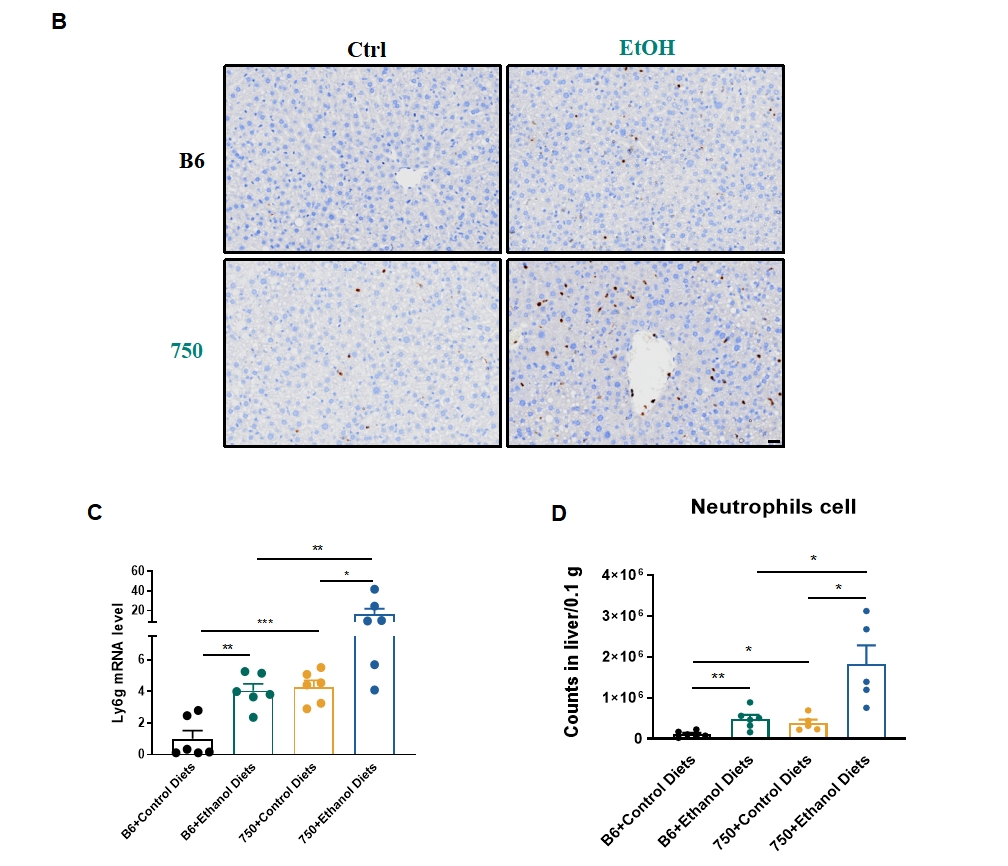
Figure 2. Chronic-plus-binge ethanol feeding aggravates fibrosis
(A) Sirius Red staining of livers (left panel) and the quantification of positive tissue. Scale bar = 50 µm. (B) Myeloperoxidase staining of liver sections. Scale bar = 20 µm. (C) Real-time quantitative PCR analyses of Ly6g. (D) The number of neutrophils in infiltration of the liver by flow cytometry. Data presented as mean ± SEM, *P<0.05, **P<0.01, ***P<0.001, unpaired t test.(n=6 mice per group).