

ConA Induced AIH Model
The ConA-induced liver injury model involves tail vein injection of concanavalin A to activate T cells and macrophages. This triggers the release of pro-inflammatory factors such as TNF-α and IFN-γ, which induce hepatic injury. This model replicates the immunopathological features of human autoimmune hepatitis (AIH), characterized by intrahepatic lymphocyte infiltration, hepatocyte necrosis, and significant elevation of serum ALT/AST levels, with injury peaking at 8 hours post-injection. Its advantages include technical simplicity, strong hepatic injury specificity, and broad applications in studying immune hepatitis mechanisms and drug screening (e.g., glucocorticoid efficacy validation). Histopathological examination reveals portal area lymphocyte infiltration and hepatocyte apoptosis, establishing this model as a vital tool for investigating Th1-type immune responses.
Male C57BL/6J mice were administered either saline vehicle (n=6) or ConA (20 mg/kg, n=6) via single tail vein injection. Plasma samples were collected at 8 h and 24 h post-injection for ALT, AST, and CBA analyses, while liver tissues were harvested for hematoxylin-eosin (HE) staining and flow cytometry.
At 8 hours post-ConA induction, hepatic injury peaks with elevated serum ALT and AST levels and heightened inflammatory cytokine expression. Concurrently, infiltration of NK cells and CD8+ T cells in the liver parenchyma increases. By 24 hours, distinct necrotic areas become evident in the liver, accompanied by a reduction in circulating inflammatory cytokine levels.
1. Study design and study groups.
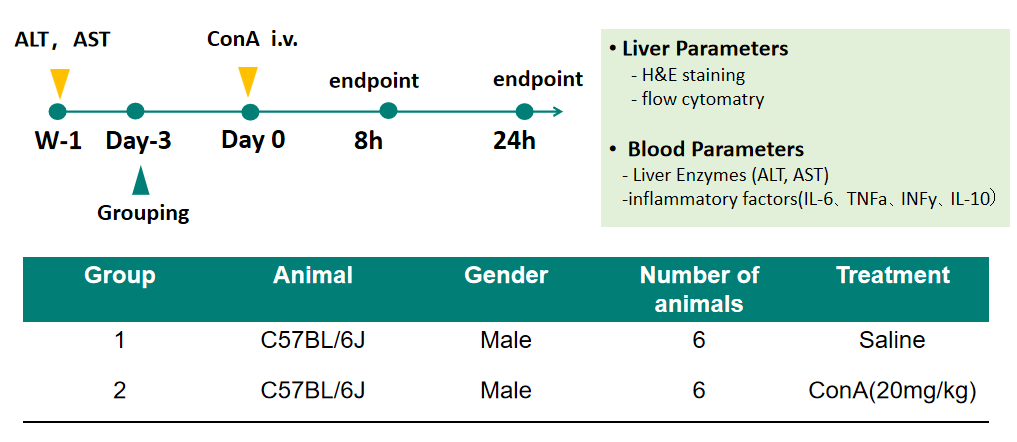
Figure 1. Study design and study groups.
2. ConA induced acute liver injury.
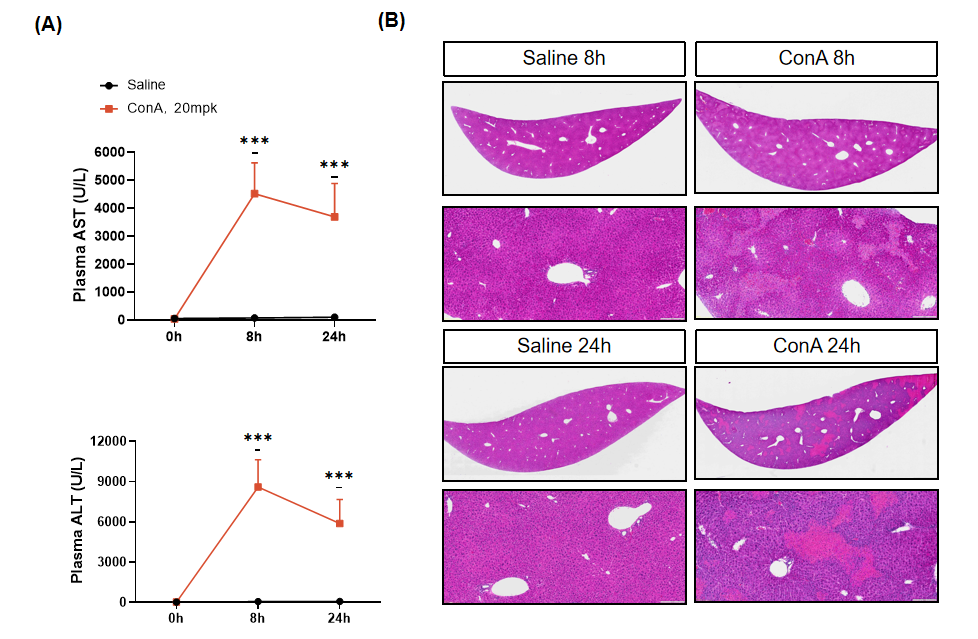
Figure 2. Liver biomarkers and histopathology following ConA induced liver injury. (A) AST and ALT level were detected before ConA injection and 8h, 12h after injection. (B) ConA induction induced necrotic areas in the liver.(Data presented as mean±SEM, n = 6 per group, *,**,***denoted p<0.05, p<0.01, p<0.001).
3. ConA induced leukocyte and T cell activation.
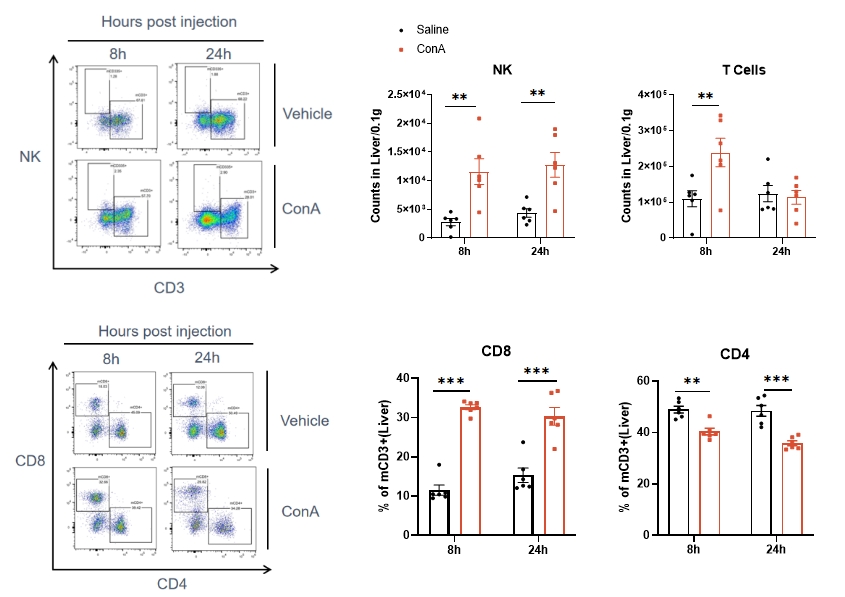
Figure 3. Flow cytometry analysis in liver. ConA induces an increase in NK cells and CD8+ T cells in the liver. (Data presented as mean±SEM, n = 6 per group, *,**,***denoted p<0.05, p<0.01, p<0.001).
4. ConA induced inflammatory factor enrichment in serum.
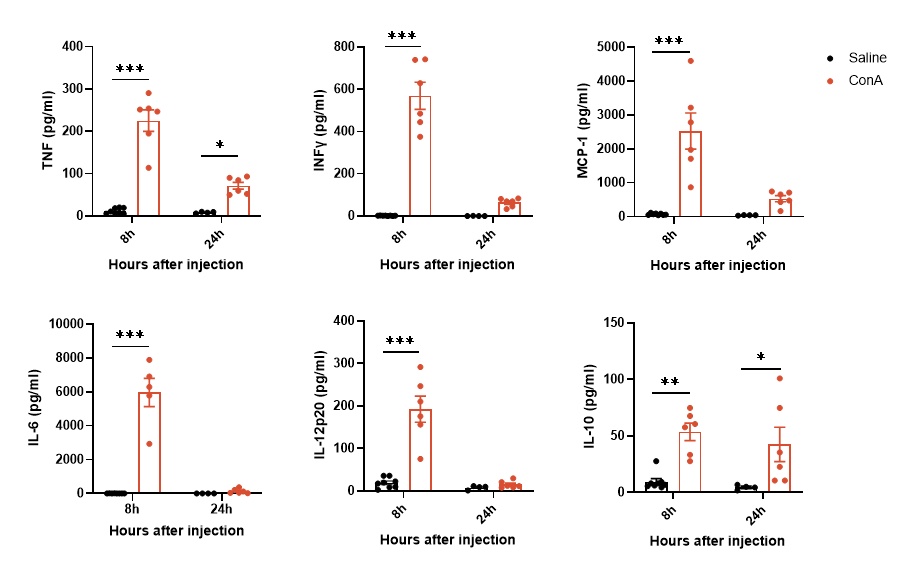
Figure 4. Cytometric Bead Array. Inflammatory factors were highly expressed at 8h and decreased at 24h after ConA induction. (Data presented as mean±SEM, n = 6 per group, *,**,***denoted p<0.05, p<0.01, p<0.001).