

B6-hPNPLA3-I148M Model
Patatin-like phospholipase-3 (PNPLA3) is a triacylglycerol lipase that mediates triacylglycerol hydrolysis in adipocytes. A non-synonymous single nucleotide polymorphism (rs738409; C>G, p.I148M) in the PNPLA3 gene was considered as a robust contributor to metabolic dysfunction-associated steatohepatitis (MASH). It was reported that there was a dose effect of the PNPLA3 I148M genotype, with CG heterozygotes bearing an intermediate risk of developing NAFLD compared to CC (lower risk) and GG homozygotes (higher risk), making this mutation an ideal target for NAFLD treatment.
To help with drug discovery efforts against MASH, GemPharmatech has generated a mouse strain T054371 bearing the coding sequence of human PNPLA3 with the I148M polymorphism.
Strategy
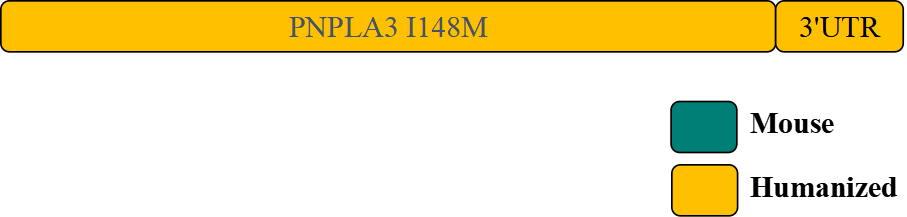
Fig.1 Schematic diagram of B6-hPNPLA3-I148M model strategy.
Supporting Data
1. Detection of PNPLA3 expression in B6-hPNPLA3-I148M mice.
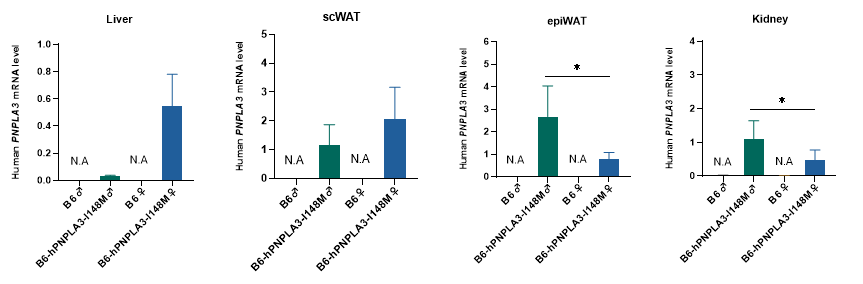
Fig 2. Expression of human PNPLA3 in B6-hPNPLA3-I148M mice.
human PNPLA3 transcript levels in the mouse model were detected by RT-qPCR. The B6 group consisted of 6-week-old B6 wildtype mice (n=3 males, 3 females) and 16-week-old B6 wildtype mice (n=5 males, 5 females) , while the B6-hPNPLA3-I148M group consisted of 6-week-old B6-hPNPLA3-I148M mice (n=3 males,3 females) and 16-week-old B6-hPNPLA3-I148M mice (n=5 males,5 females). (Data presented as mean±SEM, * denoted p<0.05)
2. Detection of mouse Pnpla3 expression in B6-hPNPLA3-I148M mice.

Fig 3. B6-hPNPLA3-I148M mice do not have detectable levels of Pnpla3 mRNA.
Pnpla3 transcript levels were not detected using RT-qPCR (n=3 males,3 females). The B6 group consisted of 6-week-old B6 wildtype mice (n=3 males,3 females) and 16-week-old B6 wildtype mice (n=5 males, 5 females), while the B6-hPNPLA3-I148M group consisted of 6-week-old B6-hPNPLA3-I148M mice (n=3 males,3 females) and 16-week-old B6-hPNPLA3-I148M mice (n=5 males, 5 females). (Data presented as mean±SEM, * denoted p<0.05)
3. Detection of I148M mutation in B6-hPNPLA3-I148M mice.
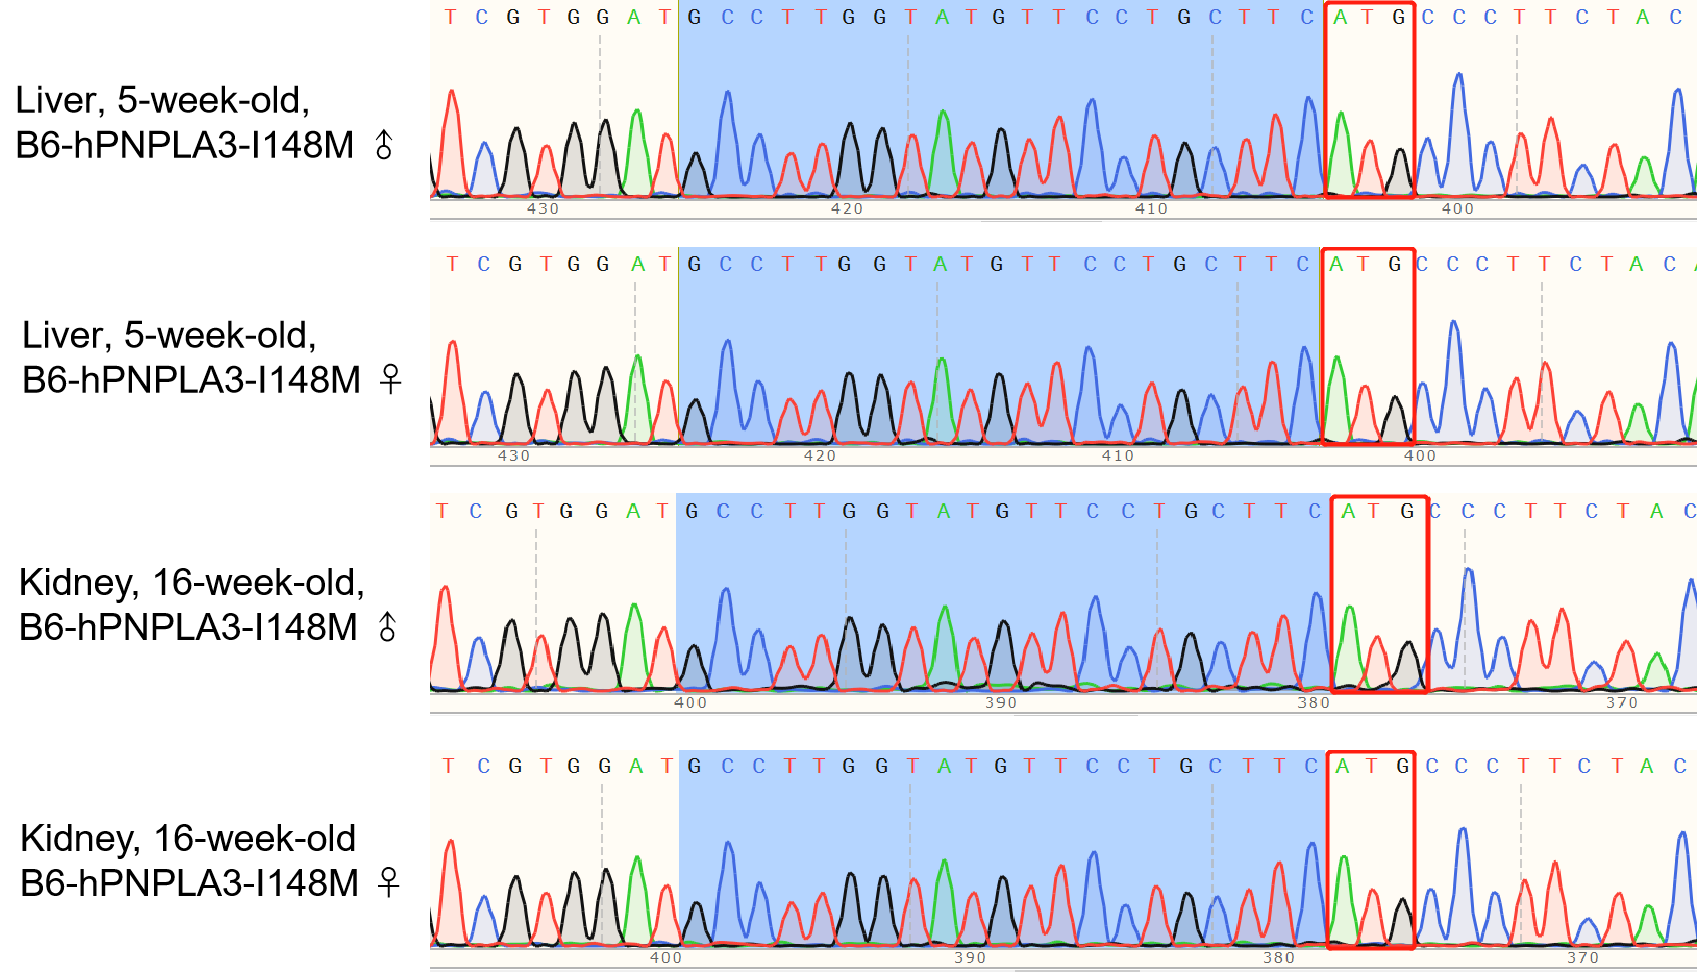
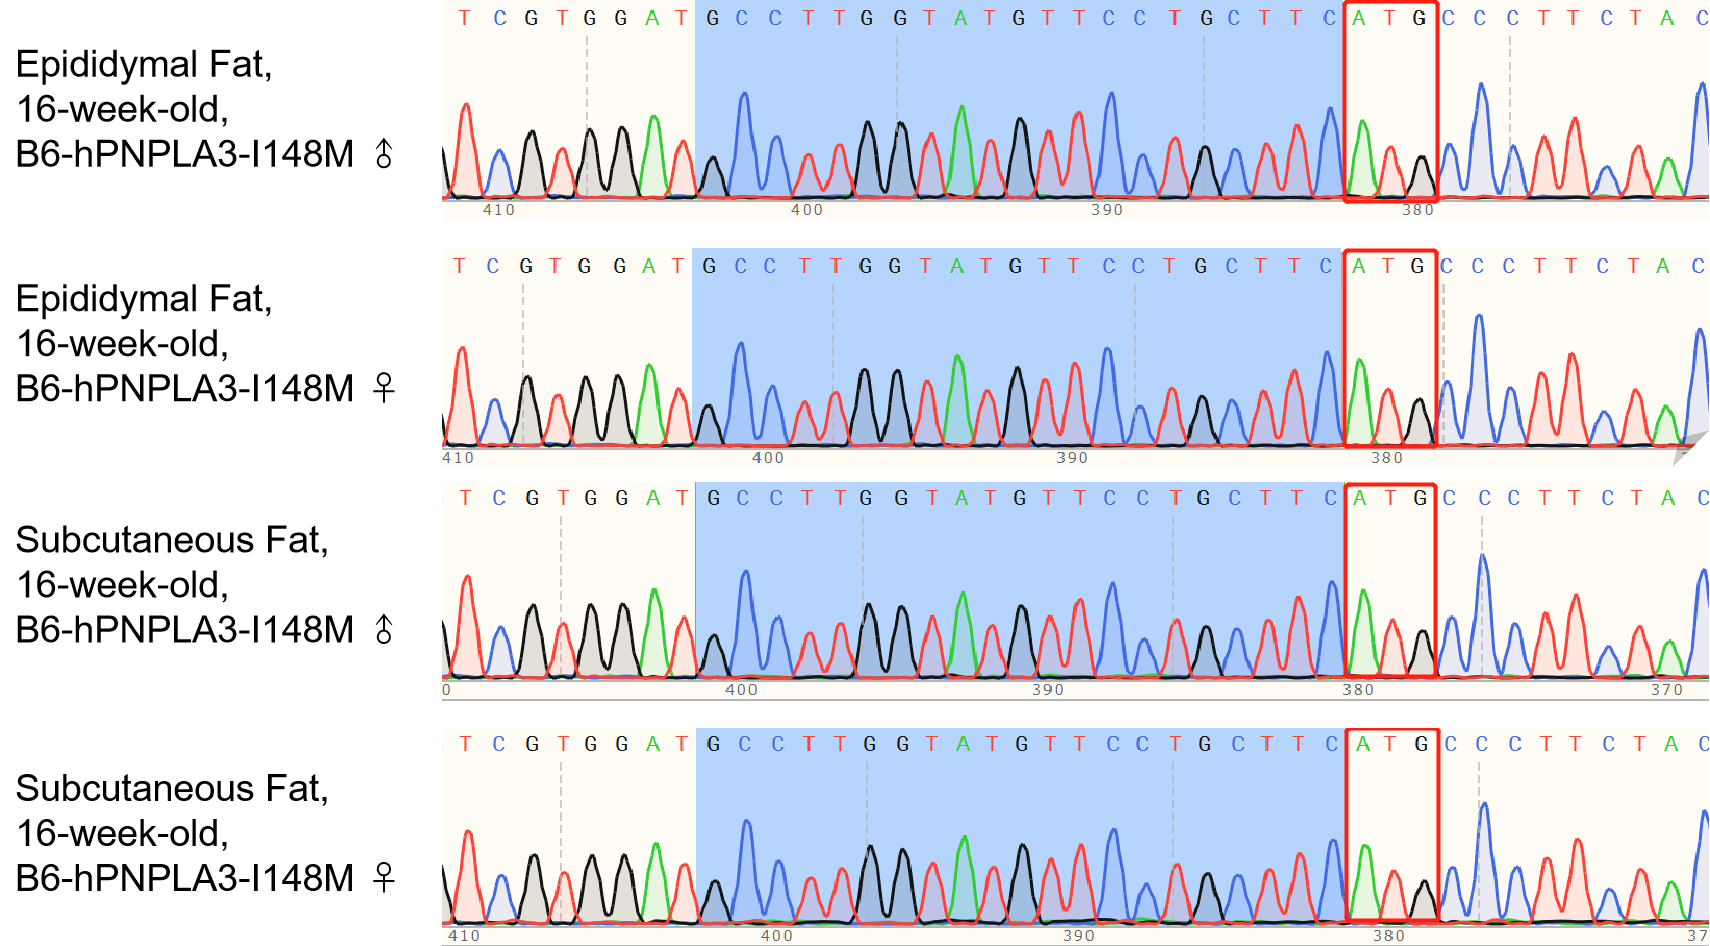
Fig 4. B6-hPNPLA3-I148M mice are positive for the I148M mutation.
High-throughput sequencing was employed to identify the I148M mutation site in the liver, kidney, epiWAT and scWAT of the B6-hPNPLA3-I148M mice (n=1 male, 1 female).
4. B6-hPNPLA3-I148M mice growth chart.
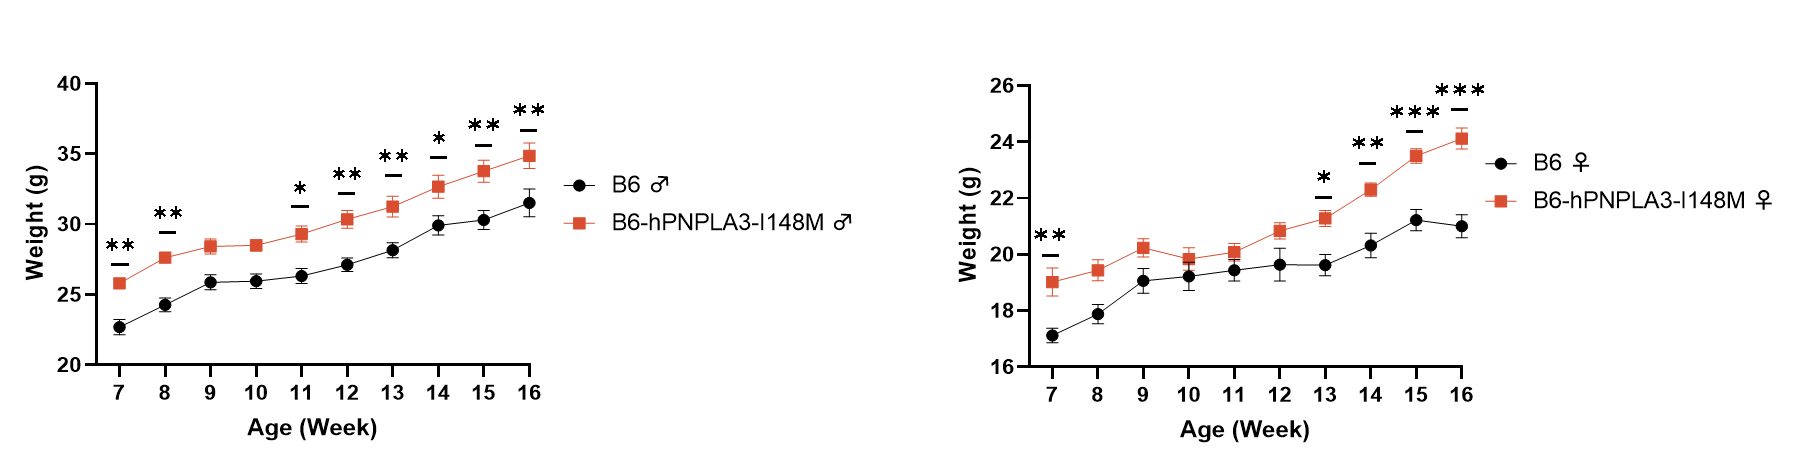
Fig 5. B6-hPNPLA3-I148M mice body weight increase compared to B6 mice.
Both B6-hPNPLA3-I148M mice (n=5 males,5 females) and B6 mice (n=5 males, 5 females) were fed with chow diet. (Data presented as mean±SEM, *,**,***denoted p<0.05, p<0.01, p<0.001)
5. Comparison of triglycerides, cholesterol between B6-hPNPLA3-I148M mice and B6 mice.
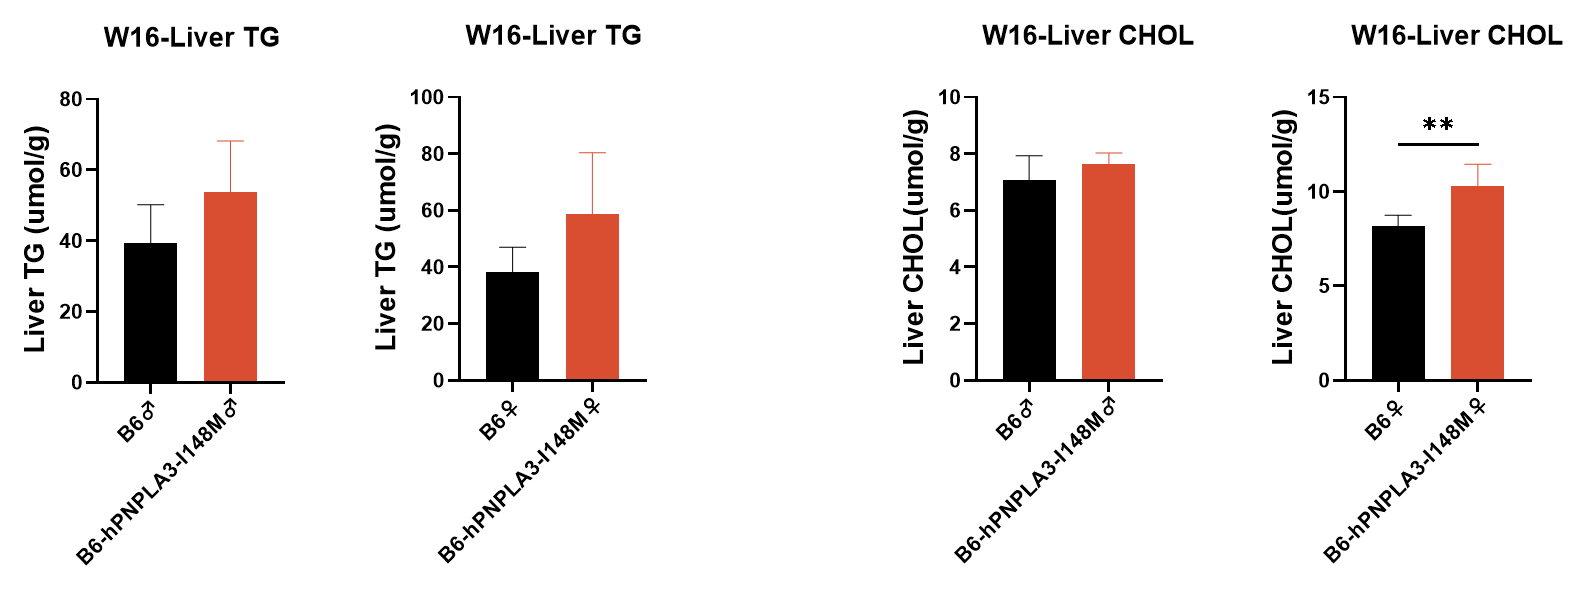
Fig 6. Both B6-hPNPLA3-I148M mice (n=5 males, 5 females) and B6 mice (n=5 males, 5 females) were fed with chow diet. (Data presented as mean±SEM, **denoted p<0.01)
6. Comparison of TG, CHOL, HDL-C and LDL-C between B6-hPNPLA3-I148M mice and B6 mice.
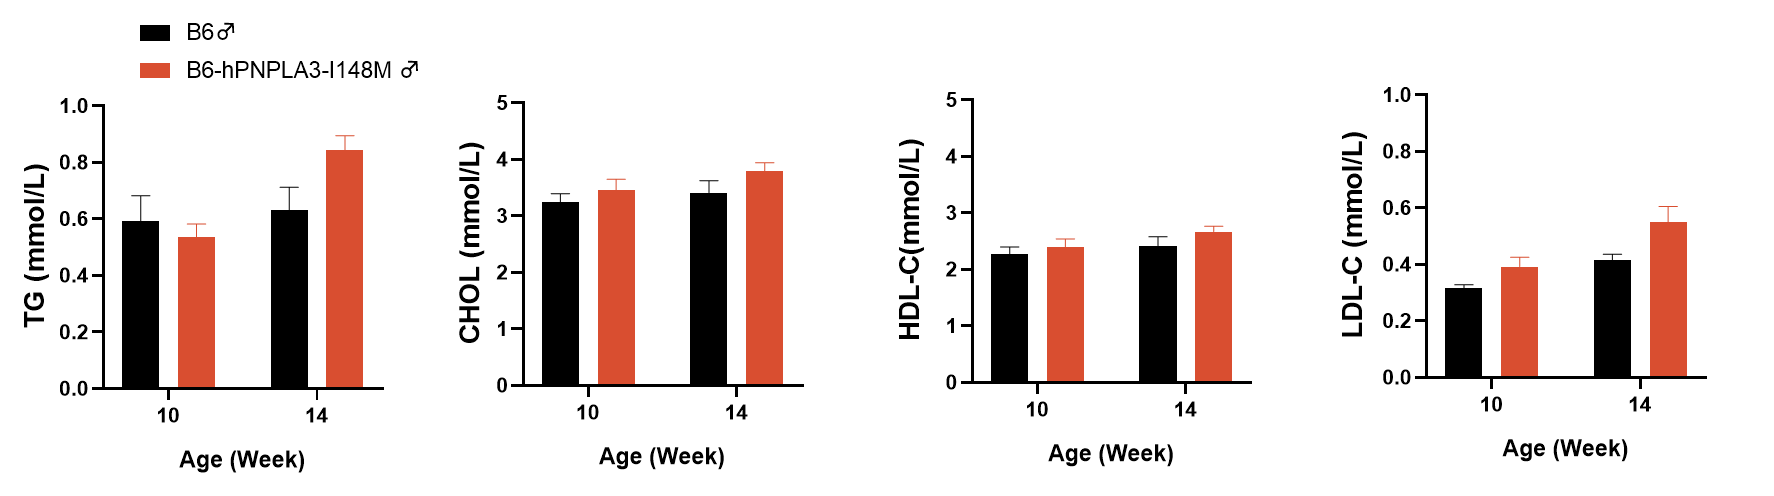
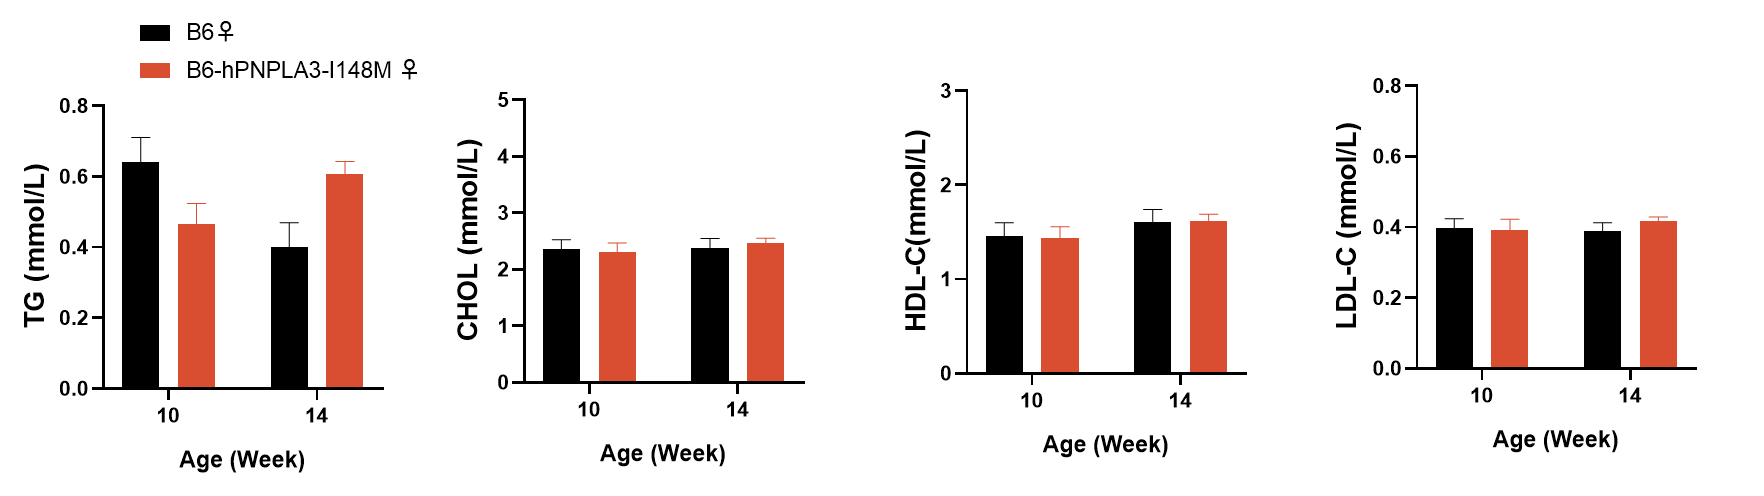
Fig 7. B6-hPNPLA3-I148M mice (n=5 males, 5 females) and B6 mice (n=5 males, 5 females) were fed with chow diet. (Data presented as mean±SEM)
7. Comparison of ALT and AST between B6-hPNPLA3-I148M mice and B6 mice.
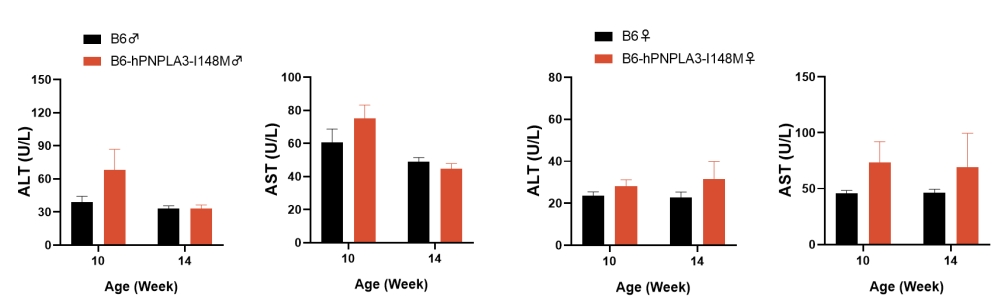
Fig 8. B6-hPNPLA3-I148M mice (n=5 males, 5 females) and B6 mice (n=5 males, 5 females) were fed with chow diet. (Data presented as mean±SEM)
8. Comparison of postprandial blood glucose between B6-hPNPLA3-I148M mice and B6 mice.
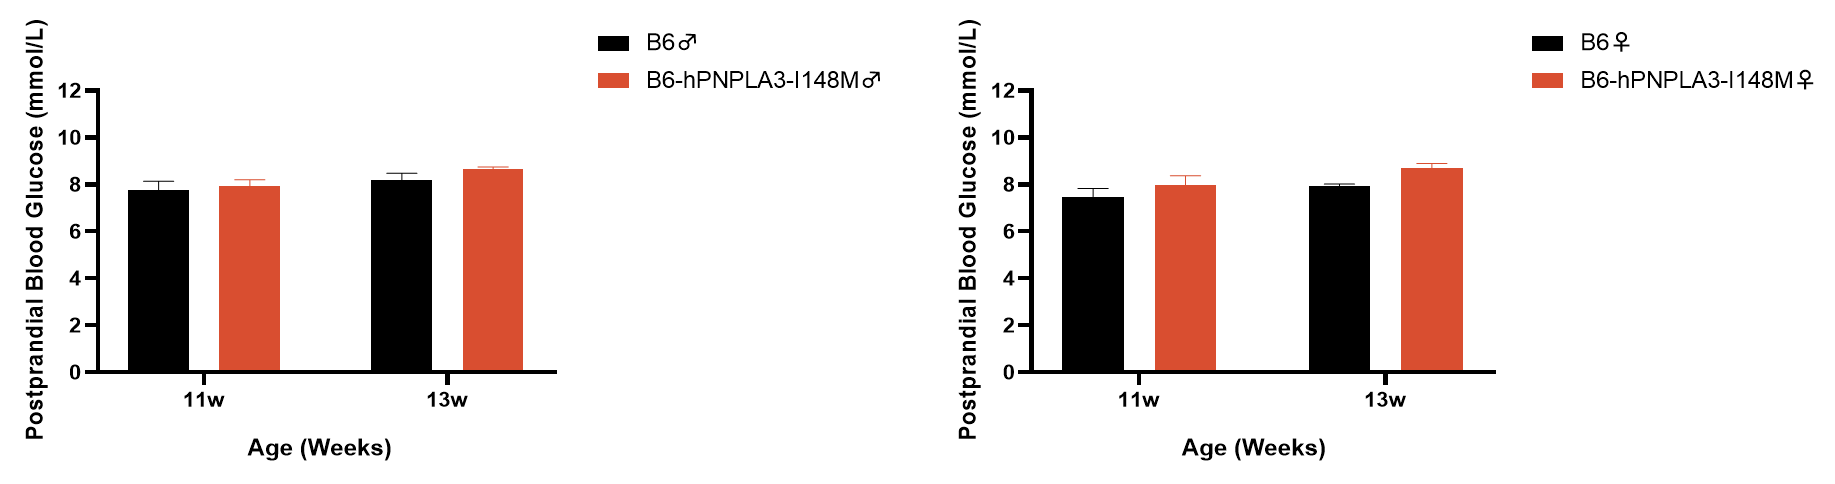
Fig 9. B6-hPNPLA3-I148M mice (n=5 males, 5 females) and B6 mice (n=5 males, 5 females) were fed with chow diet.(Data presented as mean±SEM)
9. Comparison of blood urea nitrogen and creatinine between B6-hPNPLA3-I148M mice and B6 mice.
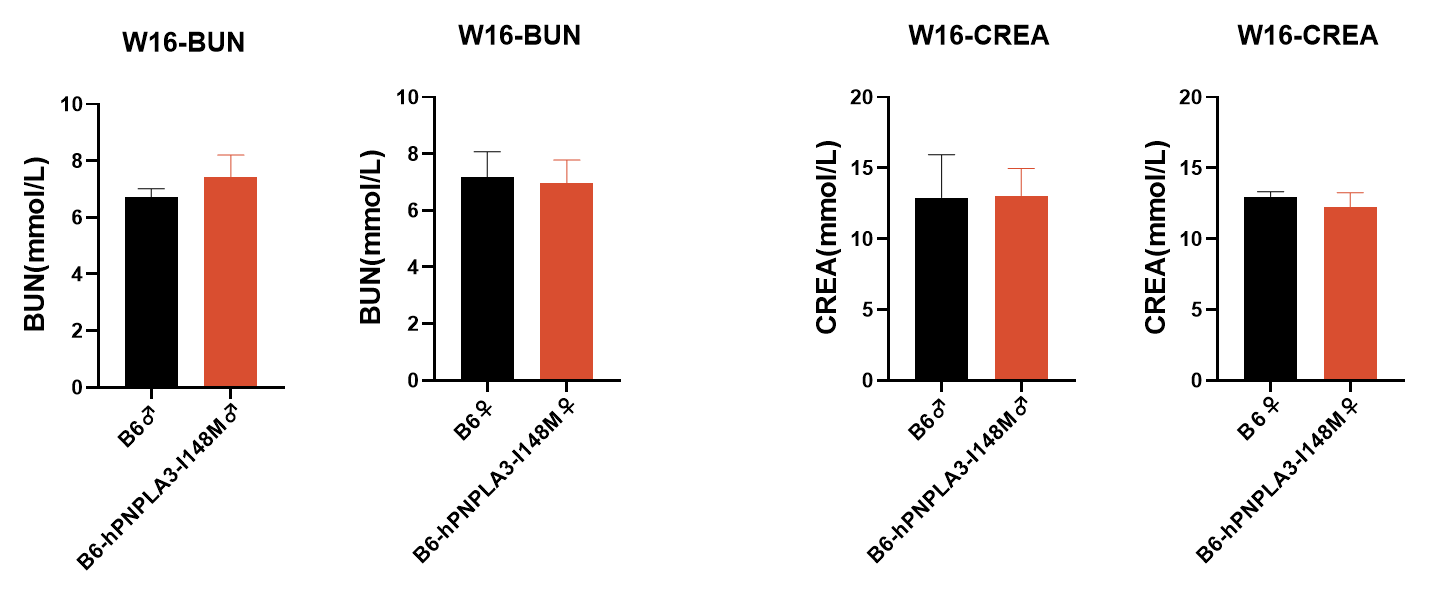
Fig 10. B6-hPNPLA3-I148M mice (n=5 males, 5 females) and B6 mice (n=5 males, 5 females) were fed with chow diet. (Data presented as mean±SEM)