

BKS-db
The leptin receptor ) gene (Lepr) encodes a Type I cytokine receptor, which is strongly linked to obesity, hypertension, diabetes, lipid metabolism disorders, etc. [1,2]. The db/db mouse, homozygous for the db mutation of Lepr gene, has reduced function of the leptin receptor and is a common model of obesity, diabetes, and dyslipidemia. The disease course is greatly affected by the genetic background, Leprdb defects in the BKS background are often accompanied by higher levels of blood sugar and body weight than wildtype BKS mice or Leprdb mice on the B6 background. Higher levels of blood glucose and gluconeogenesis enzyme activity cannot be controlled by insulin treatment in db/db mice.Standard diabetic phenotypes are accompanied by peripheral neuropathy, myocardial disease, delayed wound healing, accelerated metabolic efficiency [3], and hypothalamic lesions [4]. In addition, female db/db mice have impaired fertility together with reduced uterine and ovarian weight and decreased estrogen secretion [5-6].
The Lepr gene mutant mouse (BKS-db) was constructed on the background of BKS-misty heterozygous mice by GemPharmatech using CRISPR gene editing technology. The misty mutation and the Lepr mutation in this mouse model are located in two distinct loci on chromosome 4, resulting in segregation during the breeding process.
Study Design and Example Data
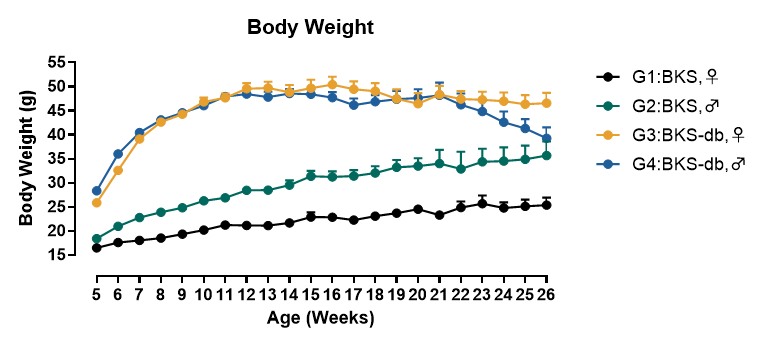

Fig 1. Weight gain and body fat data in BKS-db mice
BKS-db mice exhibit significantly higher body weight starting from 5 weeks of age, compared to wild-type mice. At 13 weeks of age, the body fat percentage of BKS-db mice is significantly higher than that of wild-type mice, demonstrating an obese phenotype. (Data are presented as Mean±SEM, G1-G2: n=10, G3-G4: n=20).*, p<0.05; **, p<0.01; ***, p<0.001; ****, p<0.0001 by one-way ANOVA with Dunnett’s pot-hoc test.
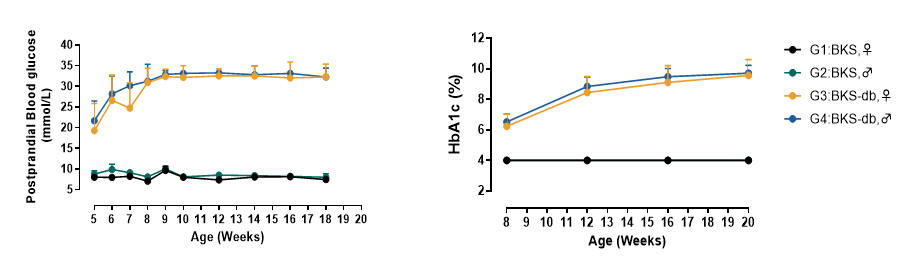

Fig 2. Increased blood glucose levels in BKS-db mice
Measuring blood glucose and glycated hemoglobin (HbA1c) data of mice aged 5 to 20 weeks, with fasting blood glucose measurements taken after a 5-hour at 8, 12, and 16 weeks.
The blood glucose and HbA1c levels in BKS-db mice are significantly increased compared to controls at all time points. (Data are presented as Mean±SEM, G1-G2: n=10, G3-G4: n=20).*****, p<0.0001 by one-way ANOVA with Dunnett’s pot-hoc test.
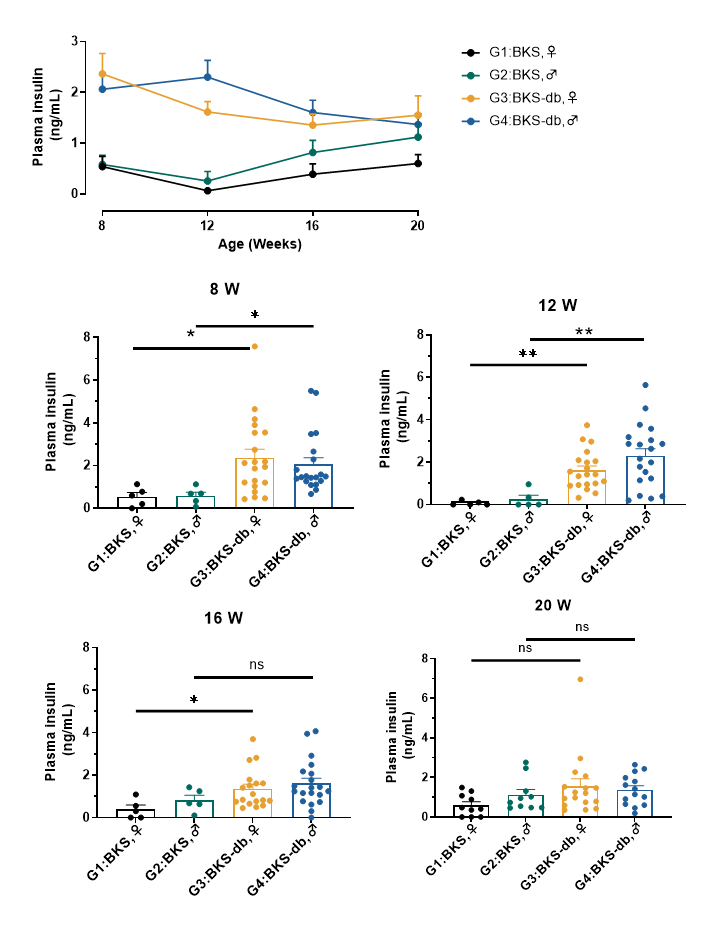
Fig 3. Increased insulin levels in BKS-db mice
Testing the insulin levels in the blood of mice at different ages: 8 weeks, 12 weeks, 16 weeks, and 20 weeks. The results indicate significant hyperinsulinemia in BKS-db mice at 8 weeks and 12 weeks. As the age increases (at 20 weeks), diabetic mice show a decrease in insulin secretion, suggesting a gradual transition into a decompensatory phase of pancreatic function. (Data are presented as Mean±SEM, G1-G2: n=10, G3-G4: n=20).ns, no significance; *, p<0.05; **, p<0.01 by one-way ANOVA with Dunnett’s pot-hoc test.
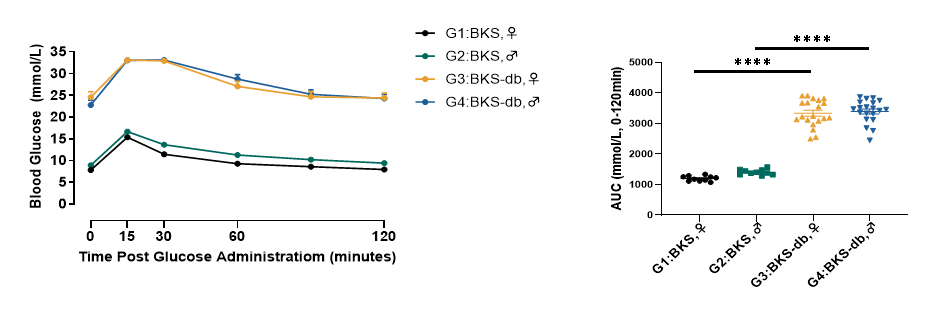
Fig 4. Glucose Tolerance Test in BKS-db Mice
A glucose tolerance test (OGTT) was conducted on 7-week-old mice, and the area under the curve (AUC) was calculated. The results demonstrate that BKS-db mice exhibit significantly reduced tolerance to orally administered glucose compared to wild-type mice. (Data presented as Mean±SEM, G1-G2: n=10, G3-G4: n=20).***, p<0.001 by one-way ANOVA with Dunnett’s pot-hoc test.
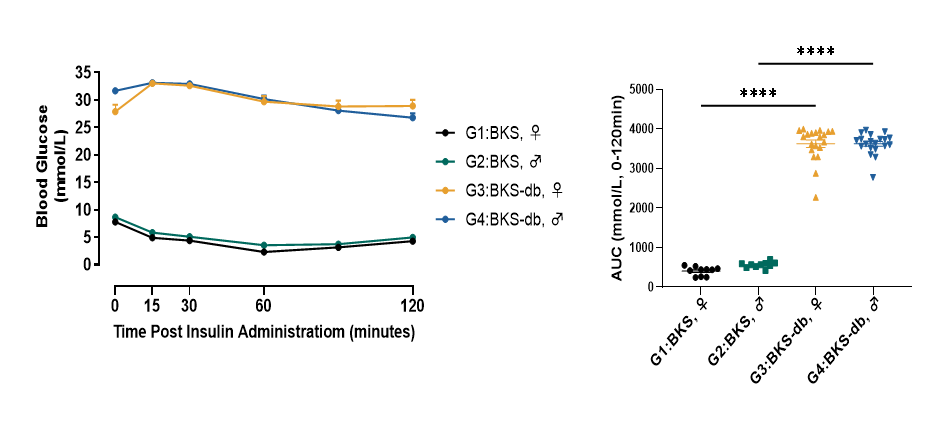
Fig 5. Insulin Tolerance Test in BKS-db Mice
An insulin tolerance test (ITT) was performed on 9-week-old mice, and the area under the curve (AUC) was calculated. The results indicate a significant reduction in insulin sensitivity in BKS-db mice compared to wild-type mice. (Data presented as Mean±SEM, G1-G2: n=10, G3-G4: n=20).***, p<0.001 by one-way ANOVA with Dunnett’s pot-hoc test.

Fig 6. Increased Blood Lipid Levels in BKS-db Mice
Blood lipid parameters including triglycerides (TG), cholesterol (Chol), high-density lipoprotein cholesterol (HDL), and low-density lipoprotein cholesterol (LDL) were measured in the blood of mice at 8 weeks. The results indicate a significant hyperlipidemia in BKS-db mice. (Data presented as Mean±SEM, G1-G2: n=10, G3-G4: n=20).ns, no significance; *, p<0.05; ****, p<0.0001 by one-way ANOVA with Dunnett’s pot-hoc test.
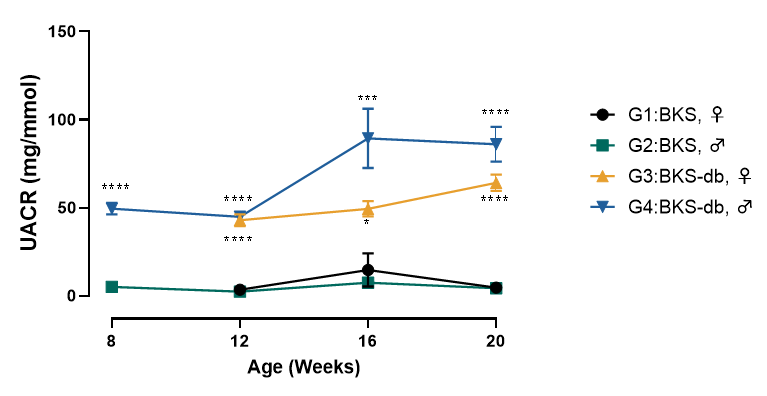
Fig 7. Early Onset of Diabetic Nephropathy in BKS-db Mice
Urinary levels of creatinine (CREA) and microalbumin (mAlb) were measured in mice at different ages (8w, 12w, 16w, 20w), and the urine albumin-to-creatinine ratio (UACR) was calculated. The results indicate that BKS-db mice start exhibiting proteinuria as early as 8 weeks of age, suggesting early signs of diabetic nephropathy. (Data presented as Mean±SEM, G1-G2: n=10, G3-G4: n=20.).*, p<0.05; ****, p<0.0001 by one-way ANOVA with Dunnett’s pot-hoc test.
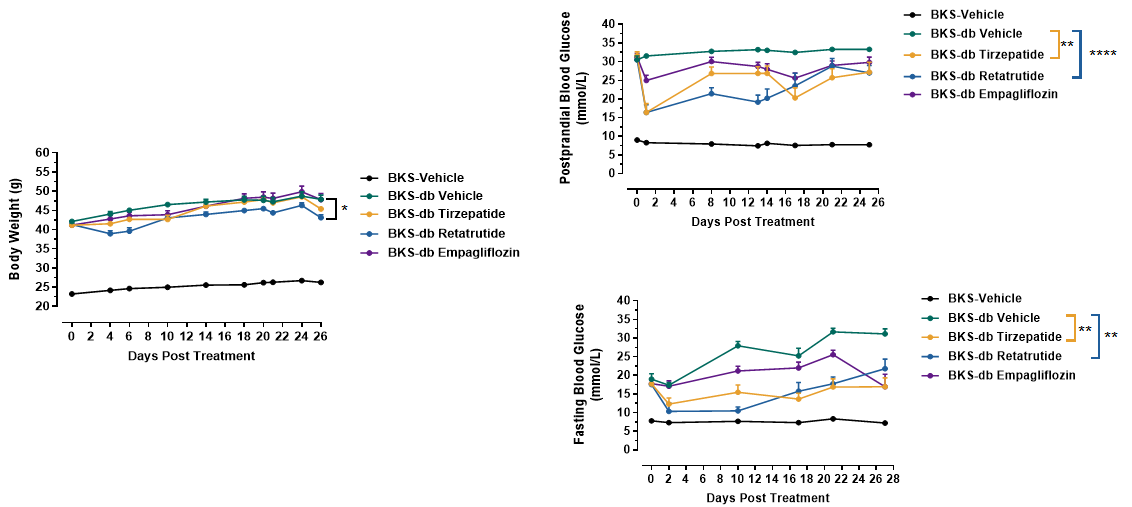
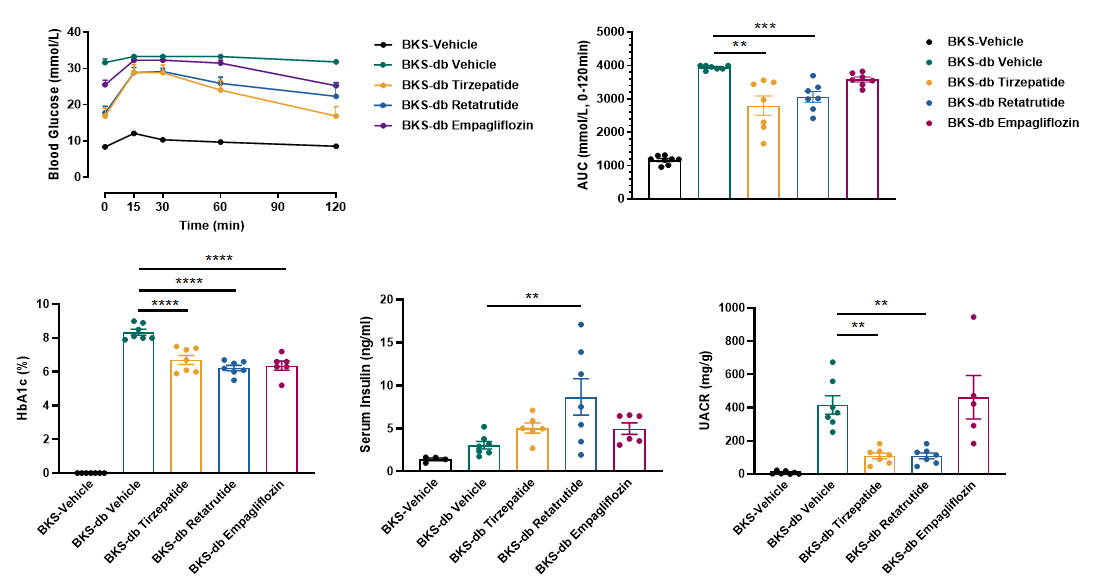
Fig 8. Drug efficacy testing in BKS-db Mice
Tirzepatide (GLP1R and GIPR agonist), Retatrutide (GLP1R, GIPR and GCGR agonist) and Empagliflozin (SGLT2 inhibitor) were tested for their hypoglycemic effects. Compared with Empagliflozin, Tirzepatide and Retatrutide had better effects on hypoglycemia, improved glucose tolerance and decreased the urine albumin-to-creatinine ratio (UACR). They had the same effect on improving the glycosylation level. Retatrutide can significantly improve islet function, increase insulin secretion, and significantly reduce body weight. (Data presented as Mean±SEM, n=7-8.).*, p<0.05; **, p<0.01; ***, p<0.001; ****, p<0.0001 by one-way ANOVA with Dunnett’s pot-hoc test.
References
1. Chen, Hong, et al. "Evidence that the diabetes gene encodes the leptin receptor: identification of a mutation in the leptin receptor gene in db/db mice." Cell 84.3 (1996): 491-495.
2. Yoon, Ji-Won, et al. "Genetic control of organ-reactive autoantibody production in mice by obesity (ob) diabetes (db) genes." Diabetes 37.9 (1988): 1287-1293.
3. Kämpfer, Heiko, et al. "Lack of interferon-gamma production despite the presence of interleukin-18 during cutaneous wound healing." Molecular Medicine 6.12 (2000): 1016.
4. Garris, Bryan L., et al. "Hypophyseal lipoapoptosis: diabetes (db/db) mutation-associated cytolipidemia promotes pituitary cellular disruption and dysfunction." Pituitary 7.1 (2004): 5-14.
5. Garris, David R. "Estrogenic stimulation of ovarian follicular maturation in diabetes (db/db) mutant mice: restoration of euglycemia prevents hyperlipidemic cytoatrophy." Cell and tissue research 318.2 (2004): 365-373.
6. Garris, David R., and Bryan L. Garris. "Genomic modulation of diabetes (db/db) and obese (ob/ob) mutation-induced hypercytolipidemia: cytochemical basis of female reproductive tract involution." Cell and tissue research 316.2 (2004): 233-241.
7. Edirs S, Jiang L, Lei X, et al. "XinKursi Wufarikun Ziyabit Improves the Physiological Changes by Regulating Endoplasmic Reticulum Stress in the Type 2 Diabetes db/db Mice." Evid Based Complement Alternat Med. 2021 Aug 16;2021:2100128.
8. Huang CZ, Xu JH, Zhong W, et al. "Sox9 transcriptionally regulates Wnt signaling in intestinal epithelial stem cells in hypomethylated crypts in the diabetic state. " Stem Cell Res Ther. 2017 Mar 9;8(1):60.